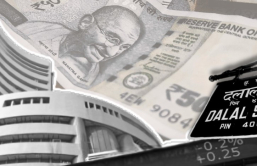
(Photo : IBT Creative)
Market watch
- UPI-based transactions in India saw a 52% surge in H1 2024, reaching 78.97 billion from 51.9 billion in the same period last year.
- The value of these transactions also grew by 40%, increasing from Rs 83.16 lakh crore to Rs 116.63 lakh crore.
- The number of POS terminals deployed crossed the 8.96 million-mark, reflecting the growing digital payment infrastructure.
- Three UPI apps - PhonePe, Google Pay, and Paytm - accounted for 94.83% of all UPI transaction volume as of June.
The digital economy of India has witnessed a significant development with the volume of Unified Payments Interface (UPI)-based transactions experiencing a remarkable surge of 52% in the first half of 2024. The volume reached 78.97 billion from 51.9 billion in the same period last year, according to a report published by Worldline, a global leader in payment services, on October 10, 2024.
The value of these transactions also grew by 40%, increasing from Rs 83.16 lakh crore to Rs 116.63 lakh crore in the first six months of this year. This growth is a testament to the increasing adoption and trust in digital payment methods among Indian consumers and businesses.
Month-on-Month Growth and Market Insights
The month-on-month analysis of the data showed a significant rise in the number of UPI transactions, from 8.03 billion in January last year to 13.9 billion in June. This growth in volume was matched by an increase in transaction value, which climbed from Rs 12.98 lakh crore in January last year to Rs 20.07 lakh crore in June. Ramesh Narasimhan, CEO of Worldline India, commented on this trend, stating, "This significant rise in UPI transactions, particularly in the person-to-merchant (P2M) segment, further cements its position as the preferred method for micro-transactions, demonstrating long-term sustainability and even movement to larger transactions in the coming years."
Digital Infrastructure and Market Dominance
In terms of infrastructure, the number of POS (point of sale) terminals deployed on the field crossed the 8.96 million-mark, reflecting the growing digital payment infrastructure in the country. This growth in infrastructure is crucial to support the increasing volume of digital transactions. The report also provided insights into the most visited in-store merchant categories, which included grocery stores, restaurants, service stations, clothing stores, government services, pharmacies, and hospitals.
Together, they represented approximately 68% of transaction volume and nearly 53% of total transaction value. In the online sector, e-commerce, gaming, utilities, government services, and financial services accounted for around 81% of transaction volume and about 74% of total transaction value. This data underscores the growing importance of digital payments in both offline and online sectors.
UPI QRs Growth and Card Transactions
The report also highlighted the remarkable growth of UPI QRs, which saw a 39% surge to 340 million from 244.23 million during the same period. This expansion in UPI QRs is also reflected in the increasing volume of UPI transactions. In terms of market dominance, three UPI apps - PhonePe, Google Pay, and Paytm - accounted for 94.83% of all UPI transaction volume as of June.
This dominance reflects the trust and reliability these platforms have built among users. In contrast to the surge in UPI transactions, the volume of card transactions in H1 2024 totalled 3.735 billion, reflecting a 3% growth from H1 2023. The total value of card transactions reached Rs 13.49 lakh crore, reflecting a 21% YoY increase.


